Zero-Trust Architecture Market Set for Robust Growth by 2030

Zero Trust Architecture Market

The zero-trust architecture market was valued at USD 17.0 billion in 2023 and is anticipated to grow at a CAGR of 18.5% from 2024 to 2030, reaching USD 55.0 billion by the end of the decade.

This market growth is attributed to factors such as the increasing frequency of cyberattacks, the rising adoption of Bring Your Own Device (BYOD) and Choose Your Own Device (CYOD) policies, expanding use of cloud services, growing digital awareness, the shift towards remote work, and compliance with stringent data protection regulations.

Zero-trust architecture (ZTA) is gaining widespread adoption as businesses across industries face an evolving cyber threat landscape. Traditional security models, which assumed all internal activity was safe, are proving inadequate. Ransomware, data breaches, and other attacks exploit these outdated approaches, with global organizations facing approximately 1,100 attacks weekly.

The COVID-19 pandemic accelerated the need for robust security measures due to the proliferation of remote workforces and mobile devices. Remote employees connecting from various locations and devices introduce new risks that traditional security protocols cannot mitigate effectively. As a result, enterprises are increasingly turning to zero-trust models to secure their distributed workforce.

Key Insights:

  • Retail and E-commerce: Expected to grow at a CAGR of 20% due to changing consumer behavior, technological advancements, and increased reliance on digital platforms.
  • Zero-Trust Necessity: Essential for protecting businesses as they adopt mobile commerce, cloud computing, IoT, and adhere to regulations like PCI DSS and GDPR.
  • Omnichannel Strategies: Vital for providing seamless customer experiences across digital and physical platforms.
  • AI and Analytics: Enable personalized customer engagement, fostering brand loyalty in a competitive market.
  • Cybersecurity Demands: Large-scale data collection requires robust security and compliance to maintain customer trust.
  • Large Enterprises: Estimated to generate USD 10 billion by 2030, driven by complex security needs and real-time authentication processes.
  • SMEs: Set to grow at a CAGR of 19%, leveraging zero-trust solutions to combat sophisticated cyber threats without incurring high costs.
  • North America: The largest market in 2023 with USD 8 billion in revenue, propelled by leading players like Palo Alto Networks, Zscaler, and Cisco, alongside advancements in cloud computing, IoT, and AI.

AI in Agriculture: Market Dynamics, Growth Projections, and Regional Performance Through 2030

AI in Agriculture Market

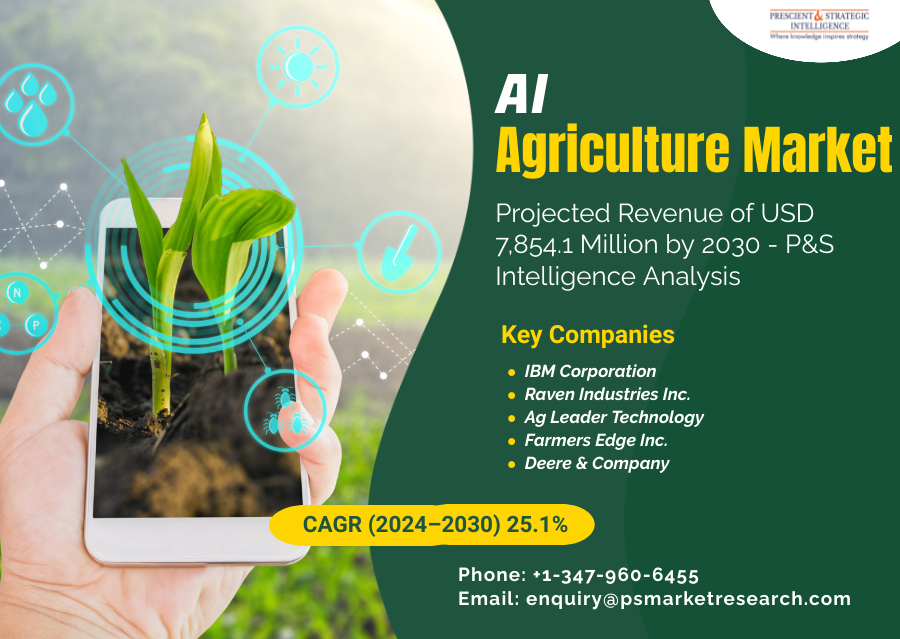
The AI in agriculture market, valued at USD 1,643.7 million in 2023, is expected to surge to USD 7,854.1 million by 2030, growing at a CAGR of 25.1%. The adoption of IoT and cloud computing is a key driver of AI demand in agriculture, enabling farmers to manage large amounts of data for better decision-making. IoT sensors are widely used for monitoring factors like crop yields, rainfall, pest levels, and soil nutrition, helping farmers optimize productivity.

The need for advanced agricultural technology is growing worldwide, driven by population increases and the need to improve crop yields. Robotics is also playing a bigger role in agriculture, allowing for more sophisticated and sustainable farming methods. Robotics companies are developing AI-equipped products for dynamic farm environments, helping stakeholders increase output while reducing carbon footprints.

Market Insights North America dominated the AI in agriculture market in 2023, capturing 45% of the market due to strong adoption of advanced technologies for productivity gains. The U.S. is projected to grow at a CAGR of over 25.5% this decade, while APAC is expected to grow the fastest, at 25.9%, due to increased adoption of precision farming, agronomic robots, and drone analytics.

The service sector is projected to grow at a CAGR of 25.3%, driven by demand for managed services that help farmers monitor sensor activities and manage crop health data. Machine learning (ML) led the industry in 2023 with nearly 50% market share, thanks to its widespread adoption in crop and field management. Precision farming held a 40% share in 2023, supported by demand for optimized yield and reduced production costs. Drone analytics is expected to grow the fastest, at over 25.7%, driven by increased investment in drone technology to support quality food production for a rising population.

The AI in agriculture market is highly competitive, with numerous international players vying for market share.

Media & Entertainment Sector Boosts Generative AI Growth

Generative AI Industry

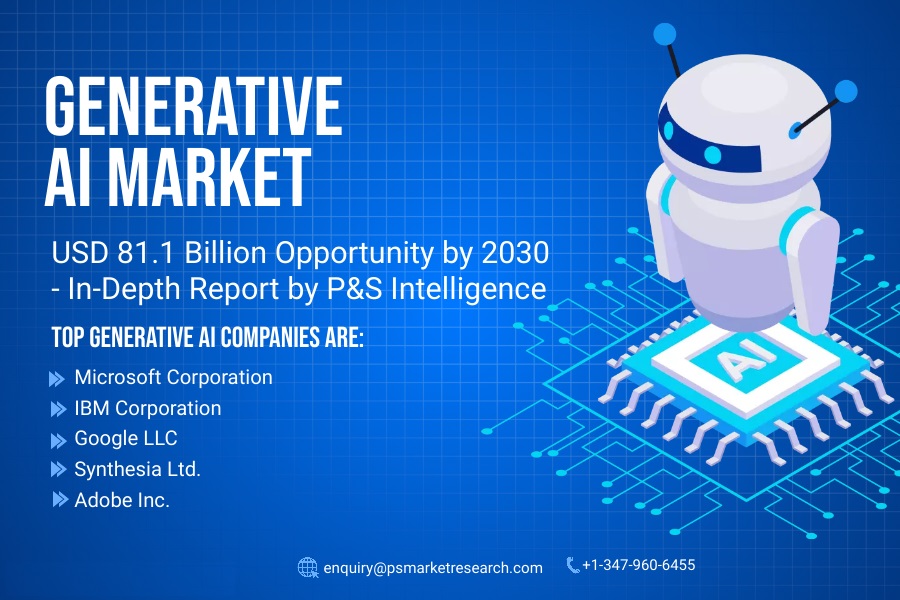
The global generative AI market reached USD 15.6 billion in 2024 and is expected to surge to USD 81.1 billion by 2030, showcasing a robust compound annual growth rate (CAGR) of 31.6% during the forecast period. This rapid growth is fueled by the technology’s potential to revolutionize industries through automation and innovation.

Generative AI leverages algorithms capable of producing realistic content by analyzing training data like images, text, and audio. A well-known example is ChatGPT, which is trained on vast datasets to perform tasks such as text summarization, sentiment analysis, and question answering.

Generative Adversarial Networks (GANs) focus on generating new data that closely mimics real-world datasets. Rather than expanding basic AI systems, these advanced methods emphasize deep learning to produce data samples. These models are multi-modal, meaning they can manage several processes at once, significantly enhancing human-machine interaction through natural language processing (NLP).

A key factor driving the growth of the generative AI industry is the development of large language models (LLMs) due to their superior ability to generate, manipulate, and comprehend natural language.

In 2023, the software segment led the market with a revenue share of approximately 55%. Software forms the backbone of generative AI, providing essential algorithms, tools, and frameworks. The natural language processing (NLP) category is also a major player, projected to grow at a CAGR of 31.8% during the forecast period. Advances in NLP are transforming applications such as chatbots, content creation, and AI systems.

The media and entertainment sector is currently the largest end user, and this category is expected to grow at an impressive CAGR of 40% during the projection period. The rapid adoption of AI tools in this sector is driving significant improvements in content creation and distribution.

In 2023, North America held the largest market share, accounting for about 50%. The region’s advanced technological infrastructure, combined with its ability to nurture disruptive AI companies, has positioned it as a leader in the generative AI space. Additionally, rising concerns over banking fraud, increasing healthcare demands, and the growth of pseudo-creativity are further contributing to North America’s dominance in the market.

Electronic Warfare Market Poised for Rapid Growth Amid Global Defense Expansion

The global electronic warfare industry was valued at USD 12.5 billion in 2024 and is anticipated to reach USD 25.3 billion by the end of the decade, growing at a CAGR of 12.4% during the forecast period. This growth is primarily driven by the enhancement of defense capabilities by numerous nations worldwide to counter emerging threats.

The electromagnetic spectrum, combined with cyberspace, forms a unified electromagnetic environment known as the cyber-electromagnetic domain. This technological advancement is emerging as a crucial focus, as this domain is expected to play a pivotal role in future conflicts.

Diplomatic and strategic relations between countries can deteriorate at any moment, turning allies into adversaries. As a result, almost all nations are enhancing their military prowess by adopting electronic warfare systems. Border-sharing countries are particularly at risk, irrespective of their current diplomatic ties, prompting them to bolster their arsenals with advanced technologies.

Electronic Warfare Industry Insights

  • The airborne segment is projected to hold the largest market share, estimated at 40% in 2024, and is expected to grow at a CAGR of 12.8% from 2024 to 2030.
  • Airborne electronic attack capabilities are vital for achieving dominance in the electromagnetic spectrum, including the ability to disable, deny, and degrade enemy air defenses.
  • Electronic decoys used in combat aircraft and missiles are instrumental in misleading enemy air defense systems.
  • The electronic support segment is the largest, with a 45% share in 2024, and is expected to experience the highest growth, with a CAGR of 12.7% over the forecast period.
  • Information derived from electronic support is critical for decision-making in both offensive and defensive operations, enabling the detection of enemy communication networks and radars.
  • Data collected is utilized for electronic intelligence (ELINT), signals intelligence (SIGINT), and communications intelligence (COMINT).
  • Signal jammers dominate the market with a 20% share in 2024 and are forecasted to be the fastest-growing category, with a CAGR of 13.2% from 2024 to 2030.
  • Jammers disrupt, deceive, or block enemy radars and communication systems by emitting interfering signals, facilitating counter-operations without being detected.
  • North America held the largest market share, around 50% in 2024, largely due to the U.S.’s significant defense investments, with a budget of USD 877 billion in 2022.
  • The U.S. heavily invests in equipping its military branches with advanced weapons and electronic warfare systems.
  • Major defense and weapons companies maintain a strong presence in the region.
  • The Asia-Pacific region is the fastest-growing market, with a projected CAGR of 12.7% during 2024–2030.
  • Several countries in the region are expanding their military capabilities with electronic warfare systems, given the geopolitical landscape characterized by strained relations.

About P&S Intelligence

P&S Intelligence offers custom and syndicated market research and consulting services to clients across the globe. Our team of young and dynamic researchers, guided by mentors with years of experience, create data-rich reports tailored to the needs of MNCs as well as startups and SMEs. We remain in a perennial quest to offer exhaustive insights into every aspect of the market, allowing businesses of all sizes to seize even the smallest of opportunities and tackle even the biggest of challenges.

Contact:
Chandra Mohan
AVP – Business Development
Phone: +1-347-960-6455
Email: enquiry@psmarketresearch.com
Web: https://www.psmarketresearch.com
Follow Us: LinkedIn Twitter

Medical Billing Outsourcing Market Doubles by 2030 as Digital Healthcare Grows

Medical Billing Outsourcing Market

In 2024, the medical billing outsourcing industry size stood at USD 15.6 billion, and it is projected to advance at a CAGR of 12.3% over the projection period, to attain USD 31.4 billion by the end of 2030.

The growth can be credited to the growing utilization of IT resources in the medical business, the increasing funding and also schemes from governments, and the increasing use of medical billing outsourcing services by hospitals, doctors, and other healthcare services, credited to their advantages.

The market for medical billing outsourcing is growing due to several key factors. There’s a rise in medical prescriptions globally, driven by increasing incidences of chronic and infectious diseases and higher hospital admissions. The COVID-19 pandemic further accelerated this trend, boosting demand for medical billing outsourcing as hospitalization rates surged. This heightened the need for robust, scalable, and collaborative digital healthcare infrastructure.

Digitalization and outsourcing have led to increased demand for advanced software technology for medical billing and patient database management. There’s also a growing adoption of electronic health records for patient care and billing purposes.

Rapidly rising demand for telemedicine or telehealth is among several trends seen in the outsourcing of medical billing. Most of the common health care services like consultation, diagnosis, discussion of health issues, treatment, and follow-up can be delivered at a distance with the help of telecommunication equipment like audio/video communicators.

Key Insights

  • Front-end services hold a substantial industry share because of their role in preregistration, registration, scheduling, insurance verification, eligibility checks, and pre-authorization, improving efficiency and patient satisfaction.
  • Middle-end services is projected to advance significantly with new entrants and augmented awareness among healthcare practitioners.
  • Out-patient bills are estimated to advance at a CAGR of 12.6%, propelled by minor injuries, outpatient operations, and improvements in medical technology.
  • The large hospital category leads the market with a 50% share in 2030, credited to their acceptance of electronic health records (EHRs) and the requirement for error-free billing processes.
  • The hospital category dominates the industry in terms of end users, propelled by the growing load of patient records management and increasing reimbursement complexities.
  • Physician offices are expected to proliferate, driven by increased healthcare spending, regulatory compliance needs, and cost reduction efforts through outsourcing.
  • North America leads the global market with a 55% revenue share in 2023, driven by technological advancements, R&D investments, and the presence of major industry players focused on customer satisfaction and service quality.
  • The adoption of medical billing outsourcing is increasing among healthcare providers due to the complexity introduced by the International Classification of Diseases-10th revision (ICD-11), driving demand for robust revenue cycle management (RCM) solutions integrated with electronic medical records (EMRs).
  • Physician offices are focusing on outsourcing to manage healthcare billing errors and operational costs, with approximately 15% of physician earnings spent on billing errors and 25% of revenue allocated to billing processes.

Growth of the E-signature Industry in Europe

Europe E-Signature Industry

In 2023, the European e-signature market generated USD 1,471.2 million in revenue. It is projected to experience a substantial CAGR of 35.4% between 2024 and 2030, reaching USD 12,177.1 million by 2030. This can be credited to the increase in the occurrence of remote working models, supportive government regulations, the surge in the size of online documentation procedures, and the cost-efficacy of e-signatures.In 2023, the European e-signature market generated USD 1,471.2 million in revenue. It is projected to experience a substantial CAGR of 35.4% between 2024 and 2030, reaching USD 12,177.1 million by 2030. This can be credited to the increase in the occurrence of remote working models, supportive government regulations, the surge in the size of online documentation procedures, and the cost-efficacy of e-signatures.

SMEs are more and more accepting of e-signatures because they get rid of paperwork and thus late flows of documents, such as those in sales and HR teams. Moreover, the number of administrative tasks is reduced by around 30%, and you have to pay nothing for materials and shipping.

The utilization of these technologies also enables the creation of good trading opportunities with the rest of the world, because it significantly cuts the travel expenses and the HR expenses for authenticated papers.

Moreover, their permeation through SMEs in Europe has increased under the COVID-19 effect, along with them keeping the workflow from remote locations since. Therefore, Paris-based SME Yousign is targeting SMEs, however not above 50,000 small and medium-sized firms in the continent by the end of 2024.

An important factor that cannot be left out is that there is a massive digital transformation around the region at a very high rate. This means that the documentation processes in the organizations and institutions end up being digitized.

Key Insights

• During the projection period, the service category is projected to advance at the highest CAGR of 35.8%.

• This development is credited to the advantages such as significantly decreased processing time from days to hours.

• Electronic services also have lower prices and advanced work efficacy; for example, in Spain, physical transactions are priced at about USD 84, while electronic ones cost between USD 6 and USD 9.

• In 2023, the BFSI industry held the largest industry share of approximately 40%, with an estimated CAGR of 36%.

• The development is propelled by the demand for customer-centric applications and BFSI’s concentration on understanding digital preferences.

• Digital signatures in BFSI guarantee identity safety, robust security, and governing compliance management.

• They streamline complex procedures and speed up client onboarding.• During the projection period, the cloud category is projected to advance at a higher CAGR of 35.8%.

• Data security is a key worry confronted by cloud-based e-signature software.

• Storing the signature key on a remote server decreases the danger of data loss to cyber criminals.

• This surges the need for cloud-based e-signature software in the continent.• In 2023, the PKI category held the largest industry share of approximately 35%.

• PKI is preferred for its standard tech permitting trust provider selection without needing an online third-party verification server.

• Clickwrap electronic signatures are estimated to have the highest CAGR of 35.7% over the projection period.

• Clickwrap signatures offer centralized contract storage for back-end records, driving demand.

• In 2023, the U.K. held the largest industry share of 34.9% because of augmented e-signature usage for digital identification.

• GOV.UK Verify which belongs to G.O.V l confirms the person using government documents like passport or driving licenses, that is to say, except one safe and quick entry process.

• Germany, which is the second largest market in Europe, has been doing that since 2001. It is on the legal grounds of the e-signature law in Germany.

Over-the-Top Services Market Growth Drivers and Forecast Report, 2030

OTT Services Market

Factors such as the rising internet speed, surging penetration of smart devices and the internet, and burgeoning demand for video-on-demand (VoD) services in developing countries are expected to steer the over-the-top services market growth during the forecast period (2021–2030). Currently, the deployment of the 5G network, to offer increased data speed at low cost, is becoming a prominent market trend. Countries such as the U.S., the U.K., Australia, Japan, Taiwan, Germany, and South Korea have already started deploying 5G networks.

The increasing penetration of the internet and smart devices is one of the key growth drivers for the market globally. Customers can access OTT content through smart TVs, internet-connected phones, tablets, laptops, desktops, gaming consoles, and set-top boxes. Moreover, the increasing amount of time being spent on these smart devices, owing to their escalating use for work and entertainment purposes, will augment the demand for OTT services. Additionally, the growing penetration of high-speed internet and advanced network technologies, such as optical fiber, 4G/LTE, and 5G, will facilitate the market growth.

At present, the OTT services market is fragmented in nature due to the presence of numerous players, such as Netflix Inc., Facebook Inc., Roku Inc., Apple Inc., Amazon.com Inc., Rakuten Inc., The Walt Disney Company, Telstra Corporation Ltd., Google LLC (YouTube), and Kakao Corp. Nowadays, these players are introducing OTT platforms and services to gain a competitive edge. For instance, in March 2021, Netflix Inc. started testing mobile+, a new plan in India for INR 299 per month. This plan will enable subscribers to stream content in 720 HD quality on computers and smartphones. However, this plan will not be accessible on TVs or multiple devices simultaneously.

The monetization model of the OTT services market is classified into advertising-based, subscription-based, and transaction-based. Under this segment, the transaction-based model is expected to witness the fastest growth throughout the forecast period as it enables market players to generate revenue by selling the license of a software product that can be utilized by a group of users or a single user. Moreover, the increasing tendency of users to purchase entire content, such as a full-license video game, with all the features will drive the growth of this category.

Furthermore, the streaming device segment of the OTT services market is categorized into smartphones and tablets, laptops and desktops, gaming consoles, and others. Under this segment, the smartphones and tablets category accounted for the largest market share in 2020 due to the rising technological advancements and growing internet penetration. According to the International Telecommunication Union (ITU), there were 4 billion internet users across the world in 2019. Additionally, this number accounted for over 51% of the global population.

Geographically, North America held the largest share in the OTT services market in 2020 due to the burgeoning internet penetration in the region. As per the ITU, nearly 88.49% of the North American population used the internet in 2018. Whereas, the Asia-Pacific (APAC) market is expected to observe the fastest growth during the forecast period as a result of the booming population, expanding smartphone user base, and increasing internet penetration in developing countries, such as China and India.

Thus, the expanding smartphone customer base and rising internet penetration will supplement the market growth.

Need for Hygienic Work Environment Drives the Professional Hygiene Market

Professional Hygiene Market

The size of the professional hygiene market will grow at a rate of 5.10% by the end of this decade, to touch USD 23,953 million by 2030.

Because of the increase in populace, shift of individuals from urban to rural areas, and surge in tourism actions, the requirement for hygiene upkeep products is increasing in the hospitality industry, which had about 40% share in the industry in the past.

The category comprises of motels, hotels, spas, food service providers, beauty salons, and other spaces where guests’ accommodation and other personal needs are catered to. One of the straightforward things that visitors expect at these places is good cleansing and hygiene.

The main driver for the development of the tissues and napkins category is the snowballing consciousness of hand hygiene in workplaces and increasing occurrence of HAIs. At hotels, hospitals, and offices, tissue and napkins are the most used products for hand drying; so, they had over 81% share in the professional hygiene market in the recent past.

Also, the progressions in the tech of making tissues, advent of organic tissue paper and cutting-edge ways of dispensing, increasing incomes, and initiatives of the government to support public health are driving the development of the industry.

The use of tissues in washrooms because of need, overall Westernization of the washroom culture, snowballing consciousness of hygiene and sanitation, and mounting living standard have augmented the requirement for finest sanitary products, for further ease.

It is due to the rising need for hygienic work environment, the demand for professional hygiene solutions will continue to grow in the years to come as well.

Enhancing Quality and Safety in Biopharmaceutical Manufacturing with Bioprocess Validation

Bioprocess Validation Market

Maintaining high-quality standards is crucial throughout the bioproduct manufacturing process. This involves eliminating contaminants and impurities from chromatographic media, which can consist of viruses, nucleic acids, endotoxins, cell membranes, aggregates, culture media components, proteins, ligands, product alterations, process chemicals, and inactive microbes.

To ensure the effectiveness of equipment and methods used in manufacturing processes, rigorous scientific validation exercises with thorough documentation are necessary. The FDA’s General Principles of Process Validation guidelines require documented evidence at all stages of bioprocess validation studies to provide a high level of confidence in the intended product quality for consumers.

Bioprocess validation is an integrated process that adheres to FDA, EMA, and other national and international regulations and standards. It aims to verify procedures and ensure compliance with current Good Manufacturing Practices (cGMP). Extensive documentation is required by national and international guidelines to confirm that the process follows standard procedures.

To improve production many drug manufacturers are turning to third-party service providers. The use of disposable technologies during medication development further reduces production costs. Single-use bioreactors have increased process adaptability and significantly reduced the risk of cross-contamination. These advancements benefit the bioprocess validation sector by shortening commercialization timelines and ensuring product reliability.

The COVID-19 pandemic has also had a significant impact on bioprocess validation. The demand for validation services increased during the pandemic as validation became necessary at all stages of drug development to monitor accuracy, safety, and efficiency. Extensive testing and manufacturing of vaccines drove the need for process validation.

Increasing Focus on Extractables/Leachables Testing Services

Bioprocess validation services include extractables/leachables testing, bioprocess residual testing, viral clearance testing, and filtration and fermentation systems testing. Extractables/leachables testing dominates this service segment due to the rising risk of product adulteration and the presence of regulatory guidelines. Prominent guidelines in this area include those from the FDA and current good manufacturing practice guidelines.

Rising Utilization of Filter Elements

Bioprocess validation products encompass filter elements, media containers and bags, freezing and thawing process bags, mixing systems, and bioreactor transfer systems. The usage of filter elements is expected to significantly increase, primarily driven by their essential role in various bioprocessing techniques to ensure the efficacy and safety of biopharmaceutical products at each production step.

The use of bioreactors for manufacturing vaccines, medicines, and other pharmaceutical components is also on the rise. Bioreactors are widely employed in healthcare research for converting in-vitro 2D culture models and suspensions into the 3D form, replicating the natural physiological state at the site.

Growing Importance of Biopharmaceuticals

The increasing prevalence of chronic diseases is driving the demand for biopharmaceuticals, leading to the rapid adoption of bioprocess validation services across the healthcare sector. Infectious diseases, cancer, and neurological disorders are becoming more prevalent, highlighting the significance of biopharmaceuticals.

Many biopharmaceuticals used to treat neurodegenerative disorders are directly administered into the brain, which is not feasible with conventional synthetic agents. Furthermore, advancements in bio-based drugs have resulted in higher survival rates for cancer patients, hepatitis cures, improved arthritis management, and transformed treatment options for various diseases. The rising incidence of such diseases drives the growth in biopharmaceutical use, thereby boosting the development of the bioprocess validation sector.

The bioprocess validation sector in Asia is advancing significantly due to increased government support for pharmaceutical research and development, a growing elderly population, and a rising trend of outsourcing in the region. Moreover, the global bioprocess validation industry is projected to reach a value of USD 835 million by the end of this decade.

Wound Care Biologics: A Rising & Advanced Trend in New Wound Care

Wound Care Biologics

Biologics, or biological medical products, are the treatment products that are produced from living cells or organisms. The improvement in the technology of wound care has resulted in the arrival of biotechnology in wound care.

Wound healing is a complicated procedure that comprises the dynamic interplay of different mediators like growth factors, cellular & extracellular components, and matrix metalloproteinases. Wound care biotechnology targets these aspects that are affected in chronic wounds. Some major wound care biological products are:

Skin Substitutes

Skin substitutes are tissue-engineered products employed to manage chronic non-healing wounds. These products can be utilized to either temporarily or permanently cover the wound bed. Skin substitutes are classified into either cellular and acellular products.

Cellular products are composed of living cells comprised inside a matrix, whereas acellular products are produced from human cadavers.

Browse detailed report analysis on Wound Care Biologics Industry Development and Future Analysis

Cell-based Therapies

The cells in the body are continuously substituted and replenished by stem cells. These cells possess exceptional posibilities in wound care because of their regenerative capacity. Adult stem cells are transplanted to the wound location either as allogeneic or autologous grafts.

Cell-based therapy focuses on making the wound bed more helpful to healing. The cells that are presently being employed in clinical settings include fibroblasts, keratinocytes, and adipose-derived stromal cells.

Growth Factors

Growth factors play an important role in wound healing. The developments in biotechnology have enabled the application and synthesis of exogenic growth factors for wound healing.

Examples of exogenous growth factors are recombinant human epidermal growth factor (rh EGF) and keratinocyte growth factor (KGF). Though, it is important to acknowledge that growth factors only function well in a properly equipped wound bed.

Scaffolds

Bioartificial scaffolds are formed of components existing in the skin extracellular matrix. These tissue-engineered scaffolds integrate laminin, collagen, fibronectin, hyaluronic acid, and endothelial progenitor cells. Scaffolds, unlike conventional wound dressings, have intrinsic world-healing properties.

Usage Of Biologics

Biologics are gradually becoming very common in wound care. Some major usages of biological materials in wound care are: ‍

Film dressings: Films formed from naturally attained polymers are biodegradable. Additionally, they can also be employed for the delivery of small molecules, growth factors, as well as various other therapeutic medicines.

Hydrogels: Hydrogels are 3D structures composed of different polysaccharides. They can imbibe substantial amounts of water which makes them suitable to preserve a moist wound environment. Because of their biocompatibility, naturally attained polymers are increasingly utilized in the production procedure of hydrogels.

Nanofiber-based dressings: Nanofiber-based dressings possess structural resemblances to extracellular matrices. Synthetic and natural biomaterials are employed to produce nanofibers with the electrospinning method.

In addition, nanofiber-based dressings are becoming more popular in wound care because of their protection from bacterial infection as well as effective exudate management.

Wrapping Up

With the increasing cases of burns & accidents, as well as the rising occurrence of chronic wounds, the wound care biologics industry will continue to grow in the coming years.